How to Analyze Your Typeform Surveys in Less Than Five Minutes
This guide will help you integrate with Typeform and analyze your survey data with ChartPixel:
We will demonstrate how easy it is to integrate with Typeform and share best practices using our own ChartPixel survey from its beta phase.
Step 1: Integrate with Typeform
Ensure you have a registered Typeform account (with admin access) and have completed at least one survey.
Go to your ChartPixel workspace and click on Integrations in the sidebar menu.
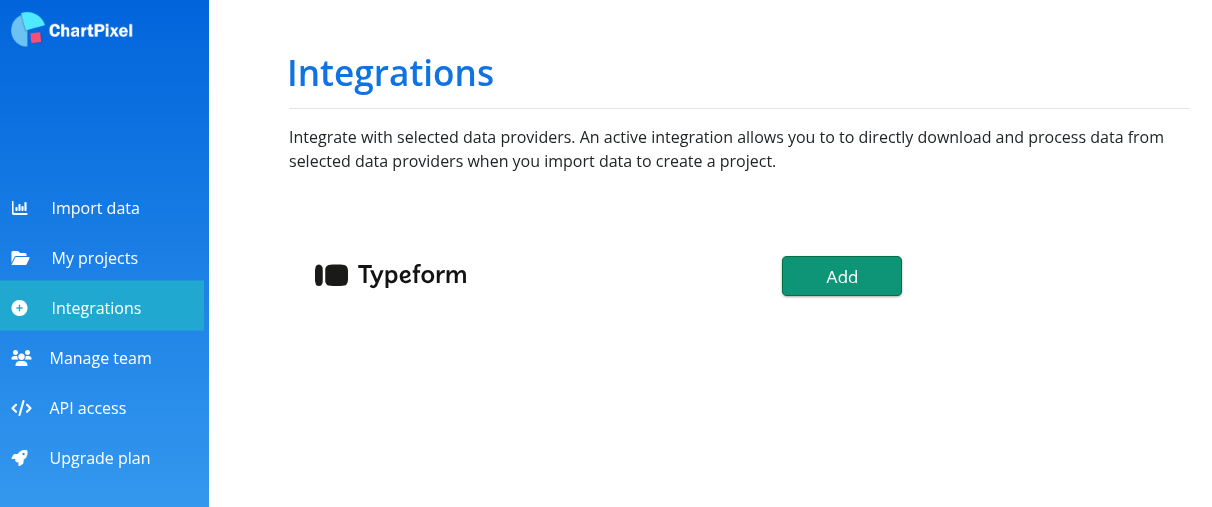
Click "Add" to navigate to the Typeform homepage and give your consent by clicking "Accept".
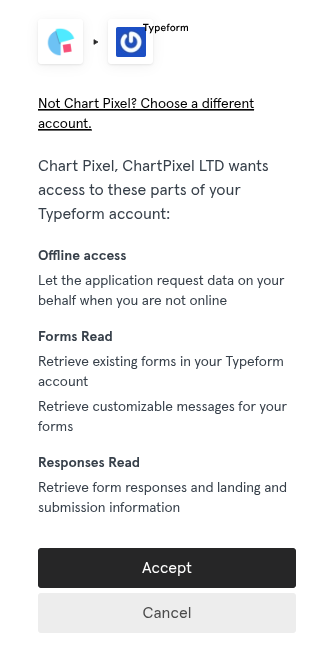
ChartPixel requires minimal access rights, including reading responses and general form information. Offline access is needed to keep the integration active when revisiting your project. Rest assured, no humans read or access your surveys. :)
After successfully creating the integration, return to your workspace. A red "Remove" button will signal that the integration is currently active. (To remove the integration, simply click it anytime).
Step 2: Create a Typeform Analysis Project with ChartPixel
Navigate to Import Data in the navigation bar. Click on the Integrations tab to see all available forms in your Typeform account.
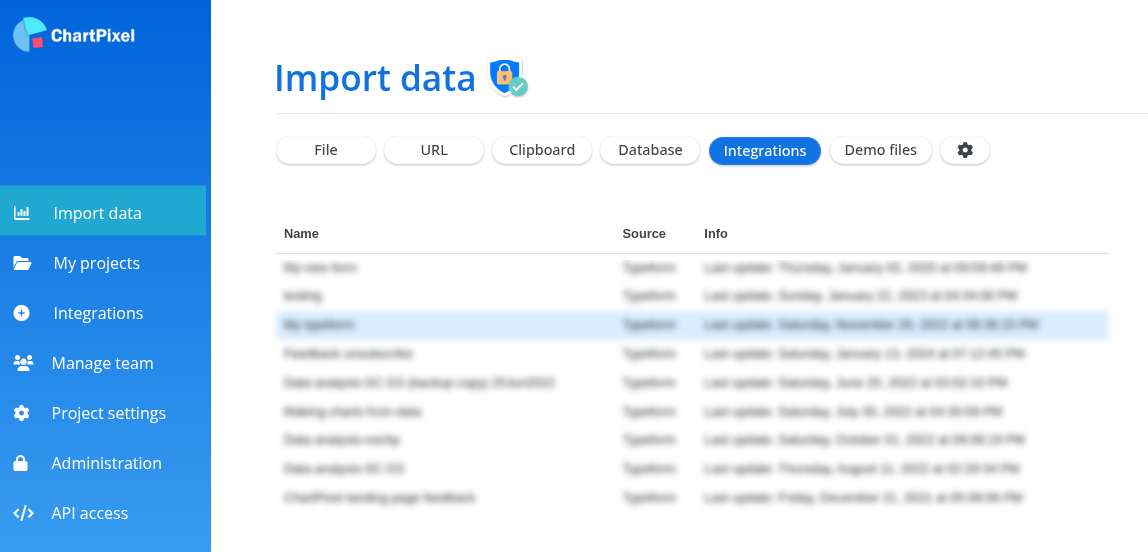
You will see a list of running or completed surveys and when they were last updated. Click on the survey you want ChartPixel to analyze.
Once ChartPixel reads your form, a column selection screen will appear. You can select or remove specific columns. Keeping the Response ID (an anonymized number) is recommended as it aids in creating specialized charts like rankings.
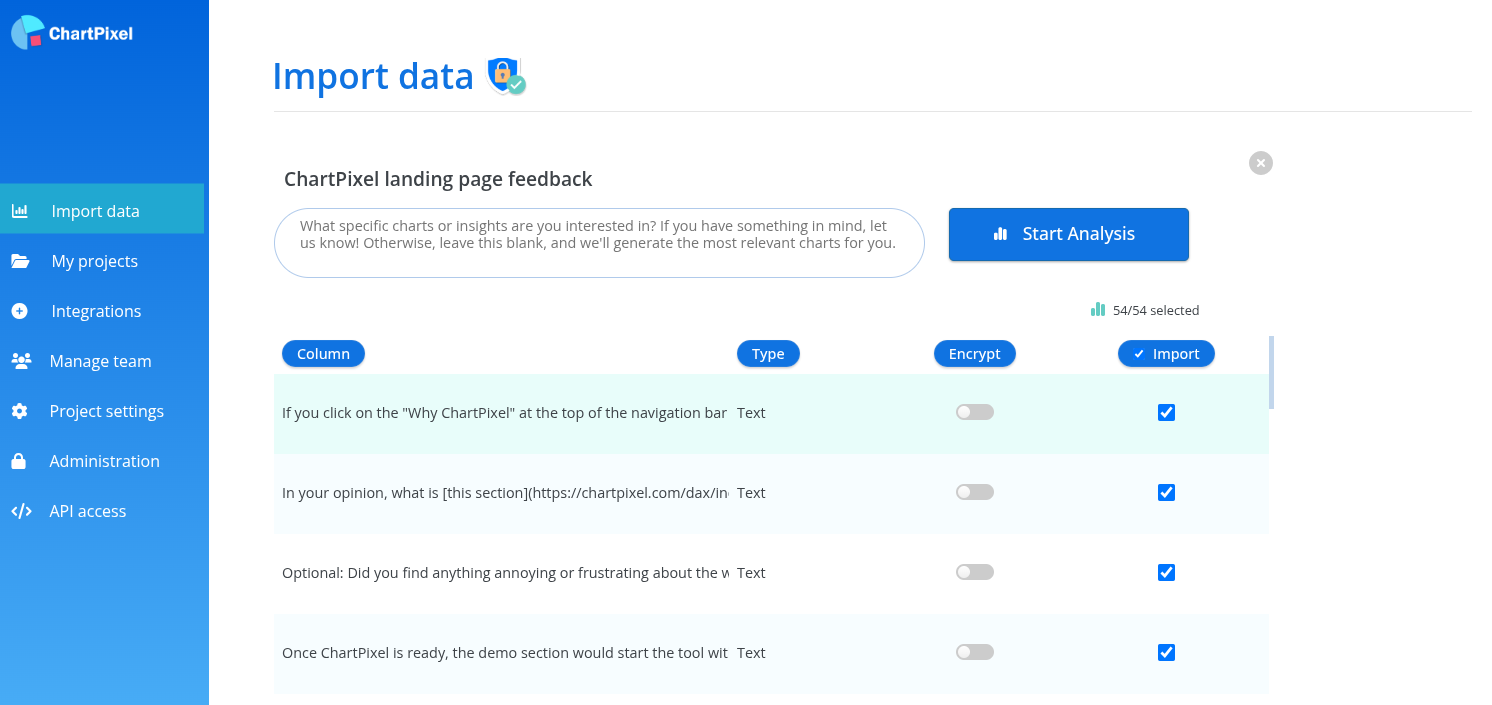
You can specify analysis focus in the text area above the column selection. For instance, focusing on a particular segment will generate more specific charts. Leaving it blank will generate the best charts across all columns.
Click Start Analysis to process your survey.
Step 3: Automated Data Processing and Wrangling
ChartPixel automatically cleans and wrangles your data to create powerful visualizations:
- Assigns sentiment and topics to comments for an overview of user feedback and its correlation with other indicators.
- Groups numerical columns for more visualizations, especially when combined with other columns.
- Recognizes order in categorical columns (e.g., "strongly disagree", "agree", "strongly agree") to extract trends.
- Groups columns from multi-select questions for comprehensive visualizations.
- Recognizes ZIP codes to create geographical data for visual maps.
- Shortens long column names for less cluttered visualizations.
Step 4: Example of Analyzing Your Typeform Responses with ChartPixel
In 2022, we launched our first landing page and conducted a market analysis survey. Here's how it looked:

We asked our beta testers, including friends and marketers, 30 questions about the page's content, images, and overall appeal. Using Typeform, we created a questionnaire including multiple-choice and open-ended questions.
Post-collection, we realized Excel was insufficient for analyzing our complex questionnaire. ChartPixel cleaned and wrangled the data for us. :)
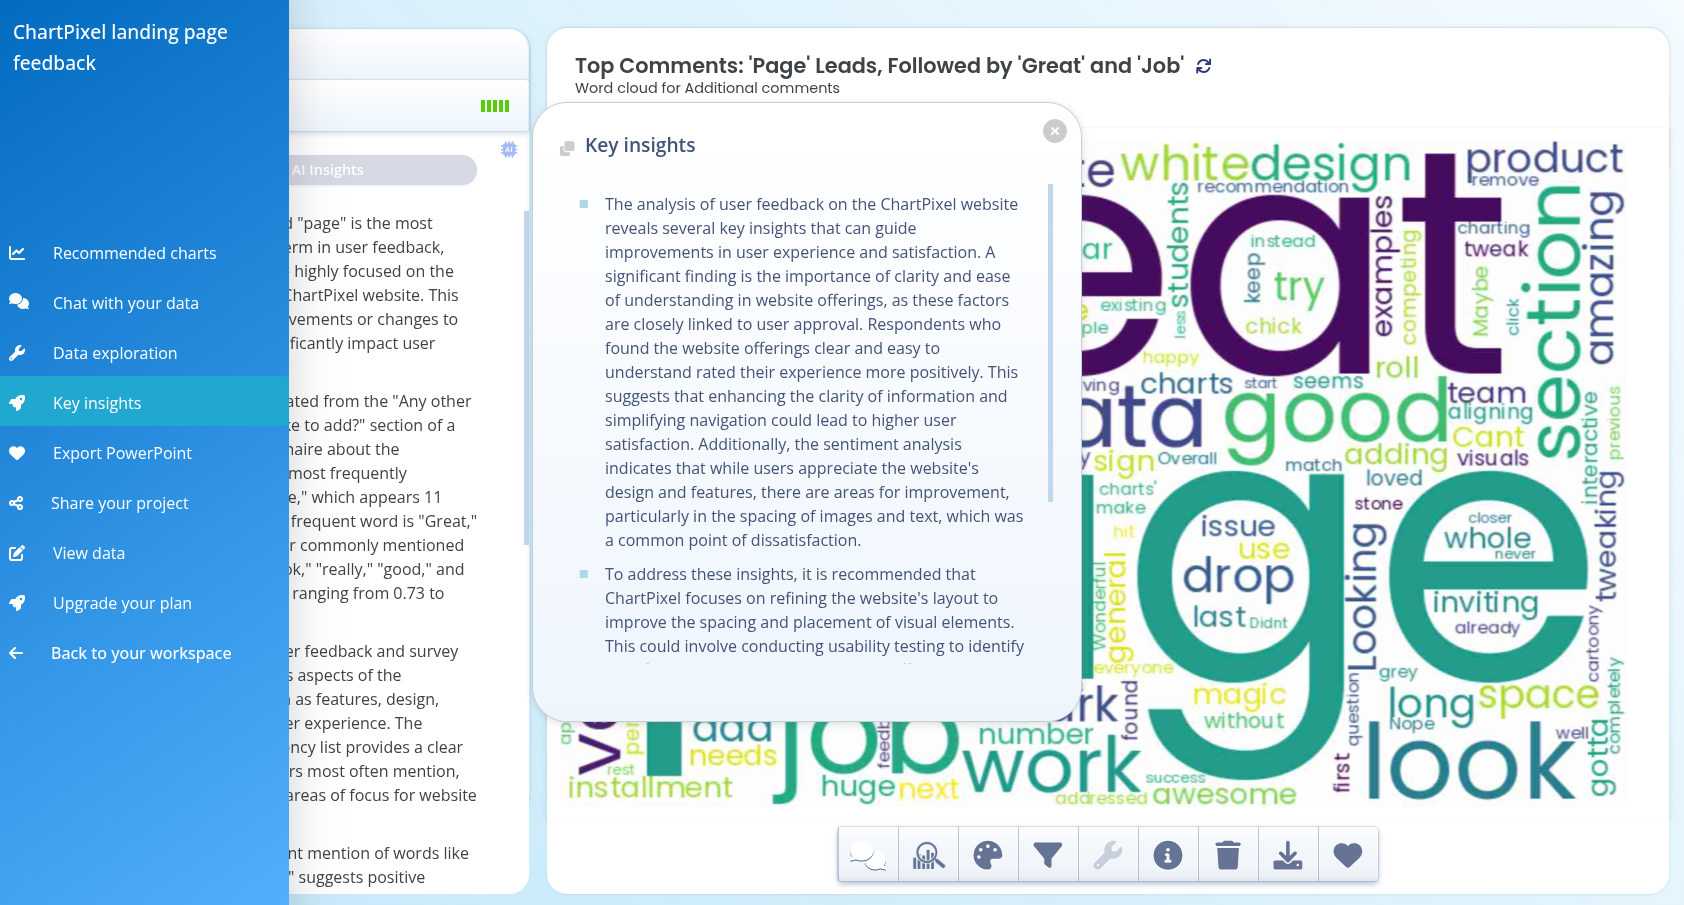
Before exploring the charts, I visited the Key Insights section via the navigation bar to view summarized insights. Here's an example from our survey asking early users about our landing page:
The summary indicated spacing issues with images, prompting us to investigate the charts for more details.
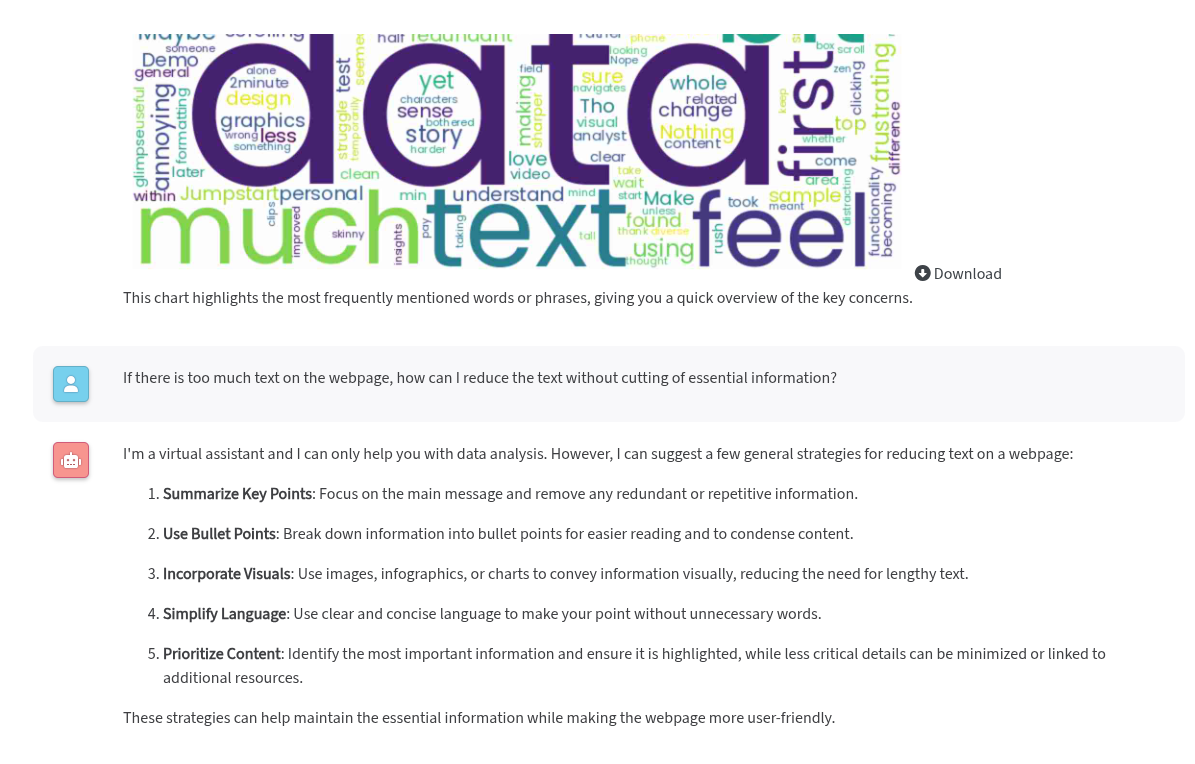
Next, I navigated to the chat section to inquire about the white space issue.
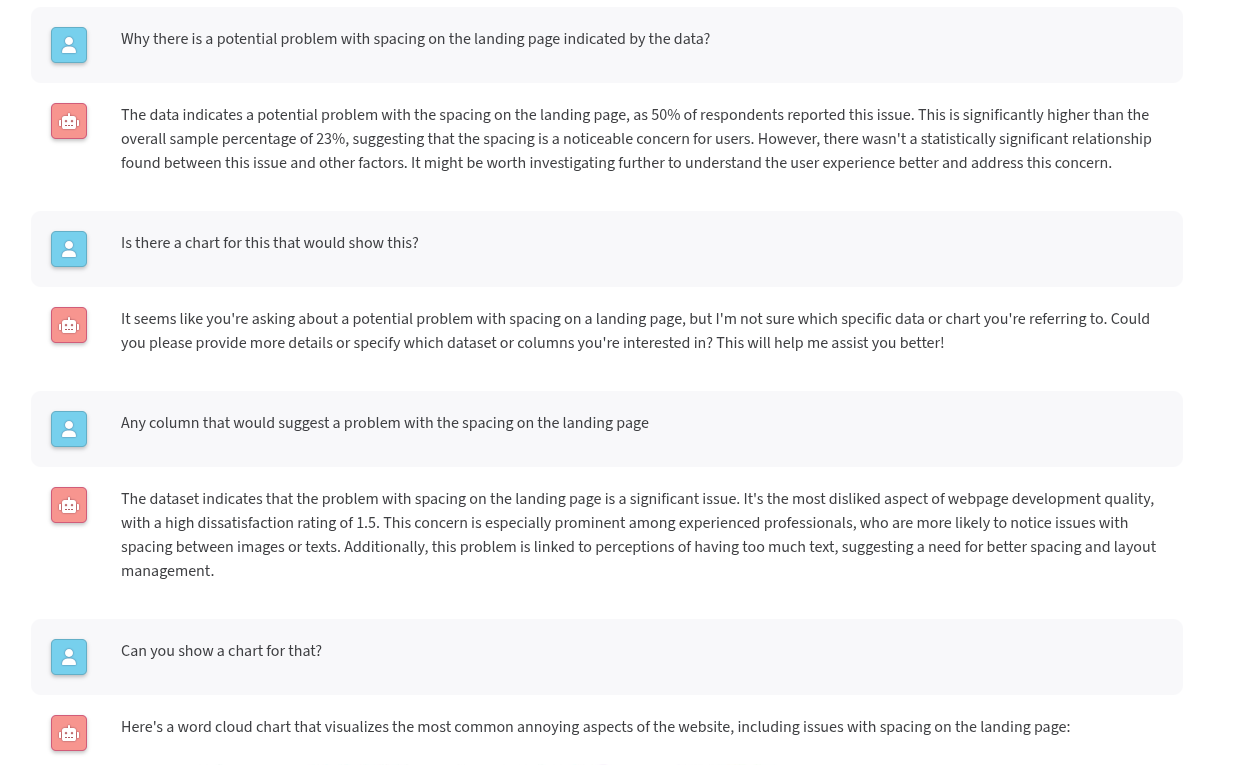
Note: The chat feature is in beta and involves some trial and error in posing follow-up questions. It is useful for contextual understanding.
I proceeded to the Recommended Charts section to find charts showing text or spacing correlations. Typing "text" in the search field produced an interesting chart. Clicking Generate AI insights in the insights section provided more information.
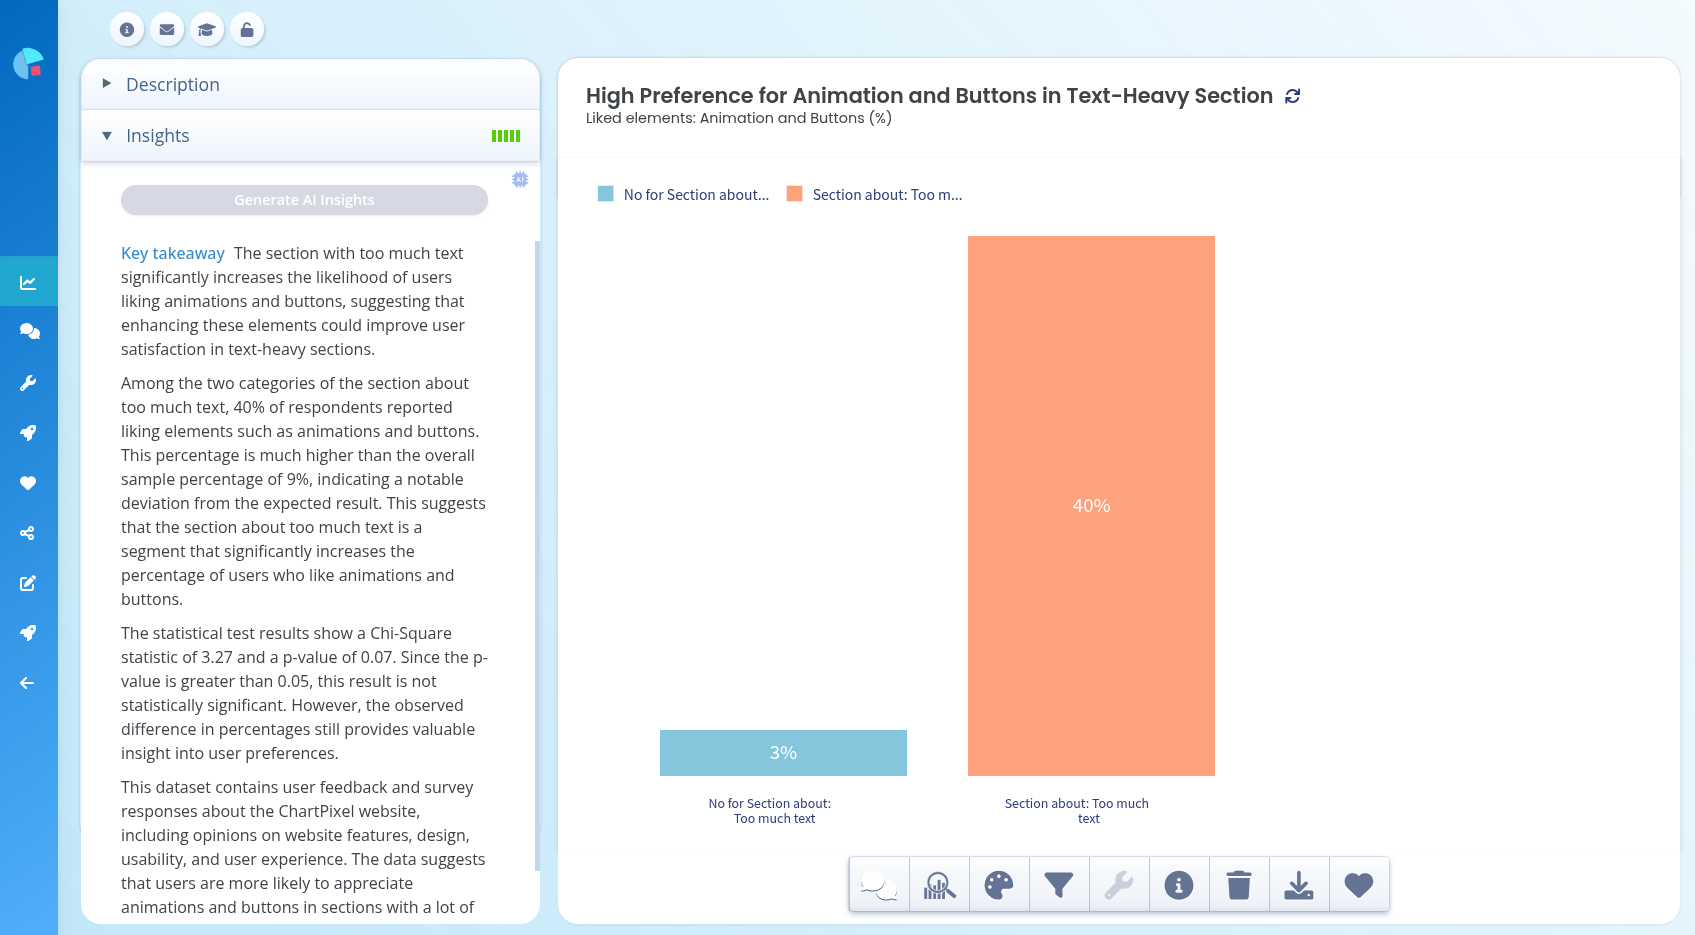
This revealed two insights: users who enjoy animations are more likely to dislike heavy text, and while indicative, results were not significant. I confirmed this by clicking on Significance in the toolbar.
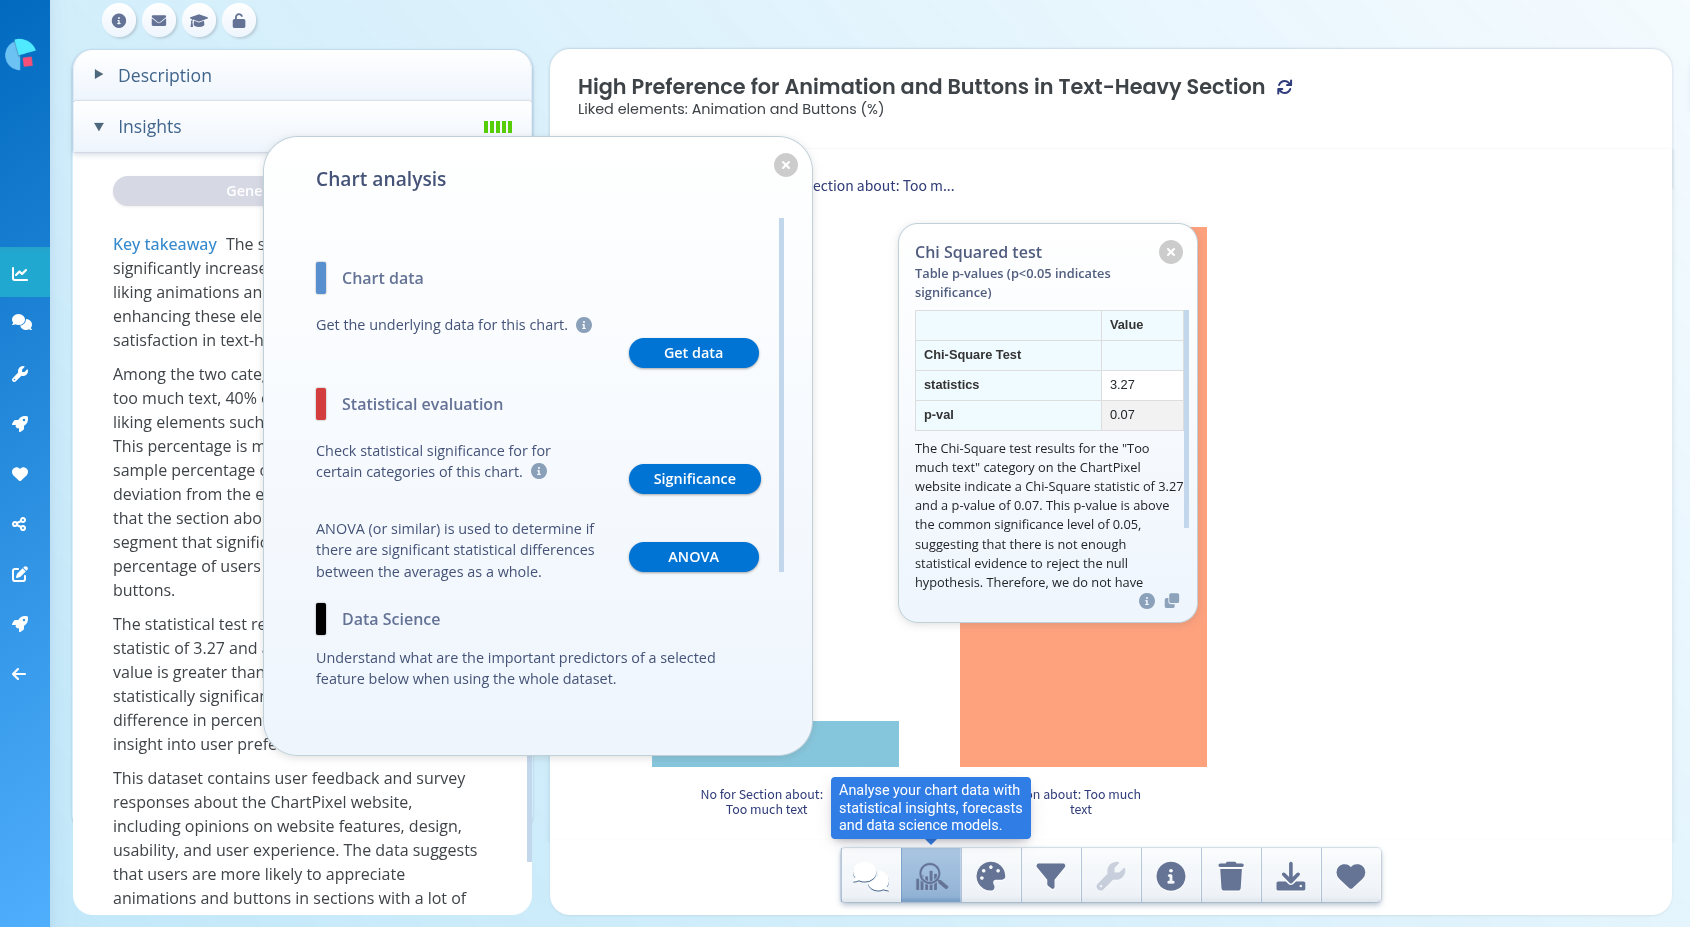
Although the test showed insignificance, it can still prompt follow-up investigations. Our small sample size rendered many results insignificant, making qualitative analysis of comments more useful.
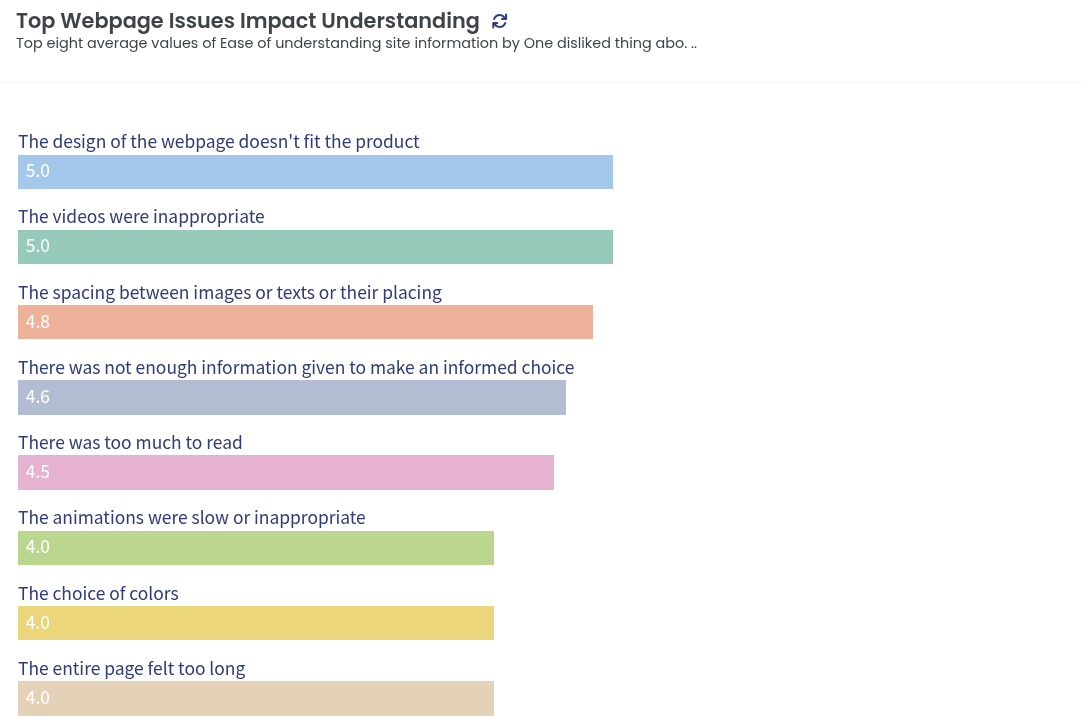
We discovered many interesting charts, such as top issues aggregated from multi-select questions.
Or the overall emotions our website conveyed, gathered from user testimonials.
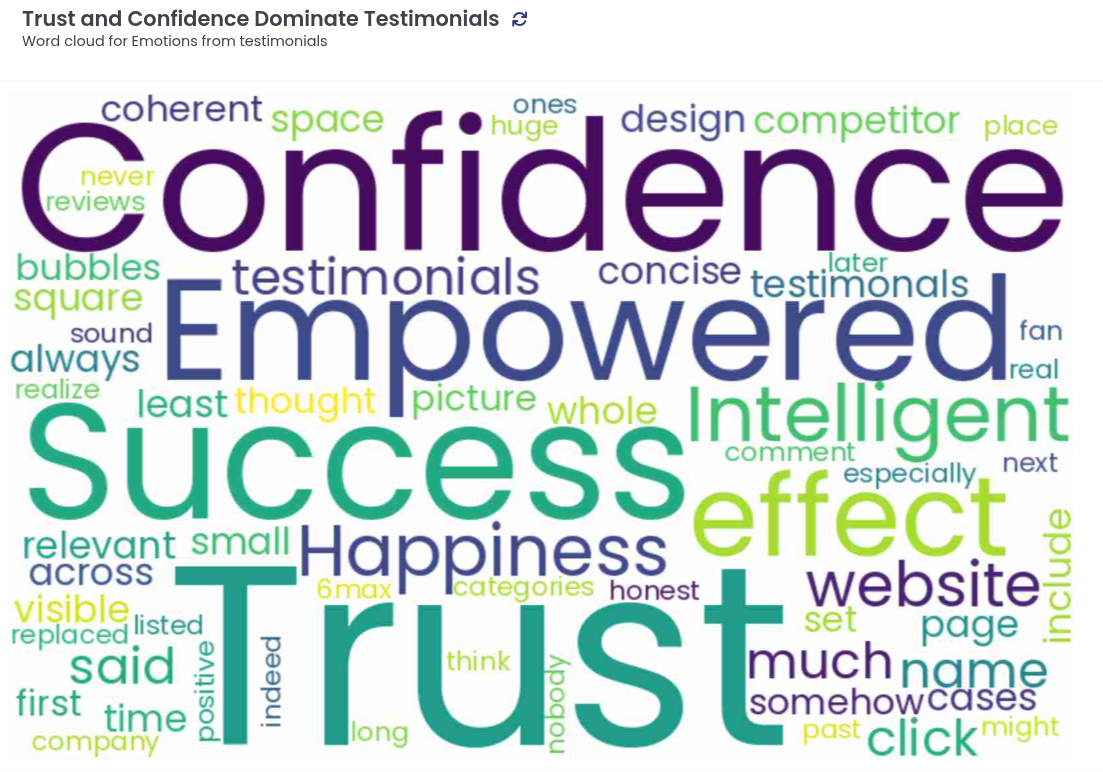
Although this is a brief review of conducting survey analysis with ChartPixel, it has been instrumental in simplifying a complex questionnaire with a small sample size. It provided valuable insights. One of the main point was that our cheesy animations reduced trust among our initial users. This lead us to enhance our website's professionalism by reducing unnecessary comical animations and excessive text and find a better balance between being playful but also a serious data analysis contendor.