How and what to upload?
We have created this guide to help you with data upload in ChartPixel. Follow these simple best practice steps to get the most out of ChartPixel's capabilities:
Step 1: Prepare your data file
- Use a CSV or Excel (xlsx) file, or a direct file URL including Google Sheets.
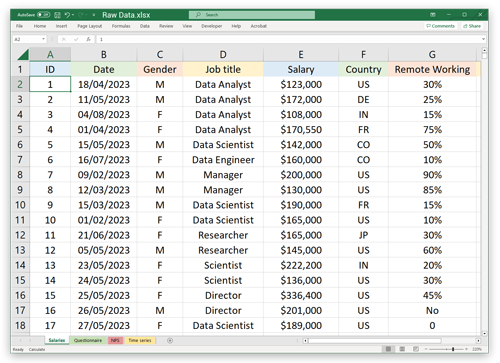
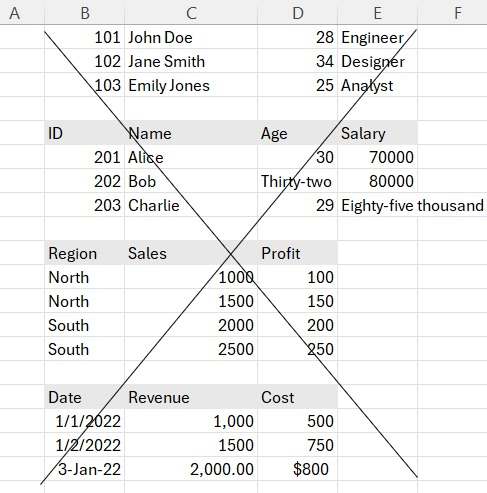
- Organize your data in a raw format, see picture for reference. Uploading raw, unsummarized data is key to unlocking the full potential of ChartPixel's analytic capabilities.
- Each column should have a clear header in the first row without abbreviations and double headers.
- Avoid footers, merged cells, and excessively long column headers.
- Include a significant number of rows (at least 20) to allow for comprehensive insights.
- Do not encode or summarize your data; ChartPixel algorithms perform best with original values.
- For Excel or Google Sheets with multiple tabs, ensure no more than 5 tabs are present.
- Limit your file to 32 columns to avoid extended processing times.
Step 2: Upload your data to ChartPixel
- Navigate to the 'Import Data' at the left side of your workspace.
- Choose your upload method from the tab menu at the top.
- For files, click on the ‘File’ tab and select your data file. Alternatively drag and drop the file into the area.
- For Google Sheets, click on the 'URL' tab copy and paste the sheet's public URL. Make sure you allow viewing rights for anyone with the link. Follow the same for other publicly available file links.
- To use data from the clipboard, simply copy your data and click ‘Clipboard’ tab in ChartPixel.
- We also support downloading data from your SQL database. Click on the ‘Database’ tab and enter your details. We do not store your database login details and if you want to download data again, you will need to enter your details anew.
Step 3: Lean back and watch your analysis come alive
ChartPixel will automatically process your data and auto-generate charts and insights once the processing is complete. Explore the insights and customize your charts as needed. Export to PowerPoint all your favorited charts or download individual charts. Alternatively share your full project with others.
If you encounter any issues or have questions during the upload process, our support team is ready to assist you. Enjoy your data-driven journey with ChartPixel!
Limits on our Free plan
- One project with one storage
- Kimited actions and chat prompts